

Optimization
Where an ELISA is designed from scratch, each step must be thoroughly optimized to achieve the maximal assay window (the difference between full signal and background). Although a lesser degree of optimization is necessary when using pre-configured ELISA kits or matched antibody pairs, it is still essential that researchers establish optimal settings for their own unique study.
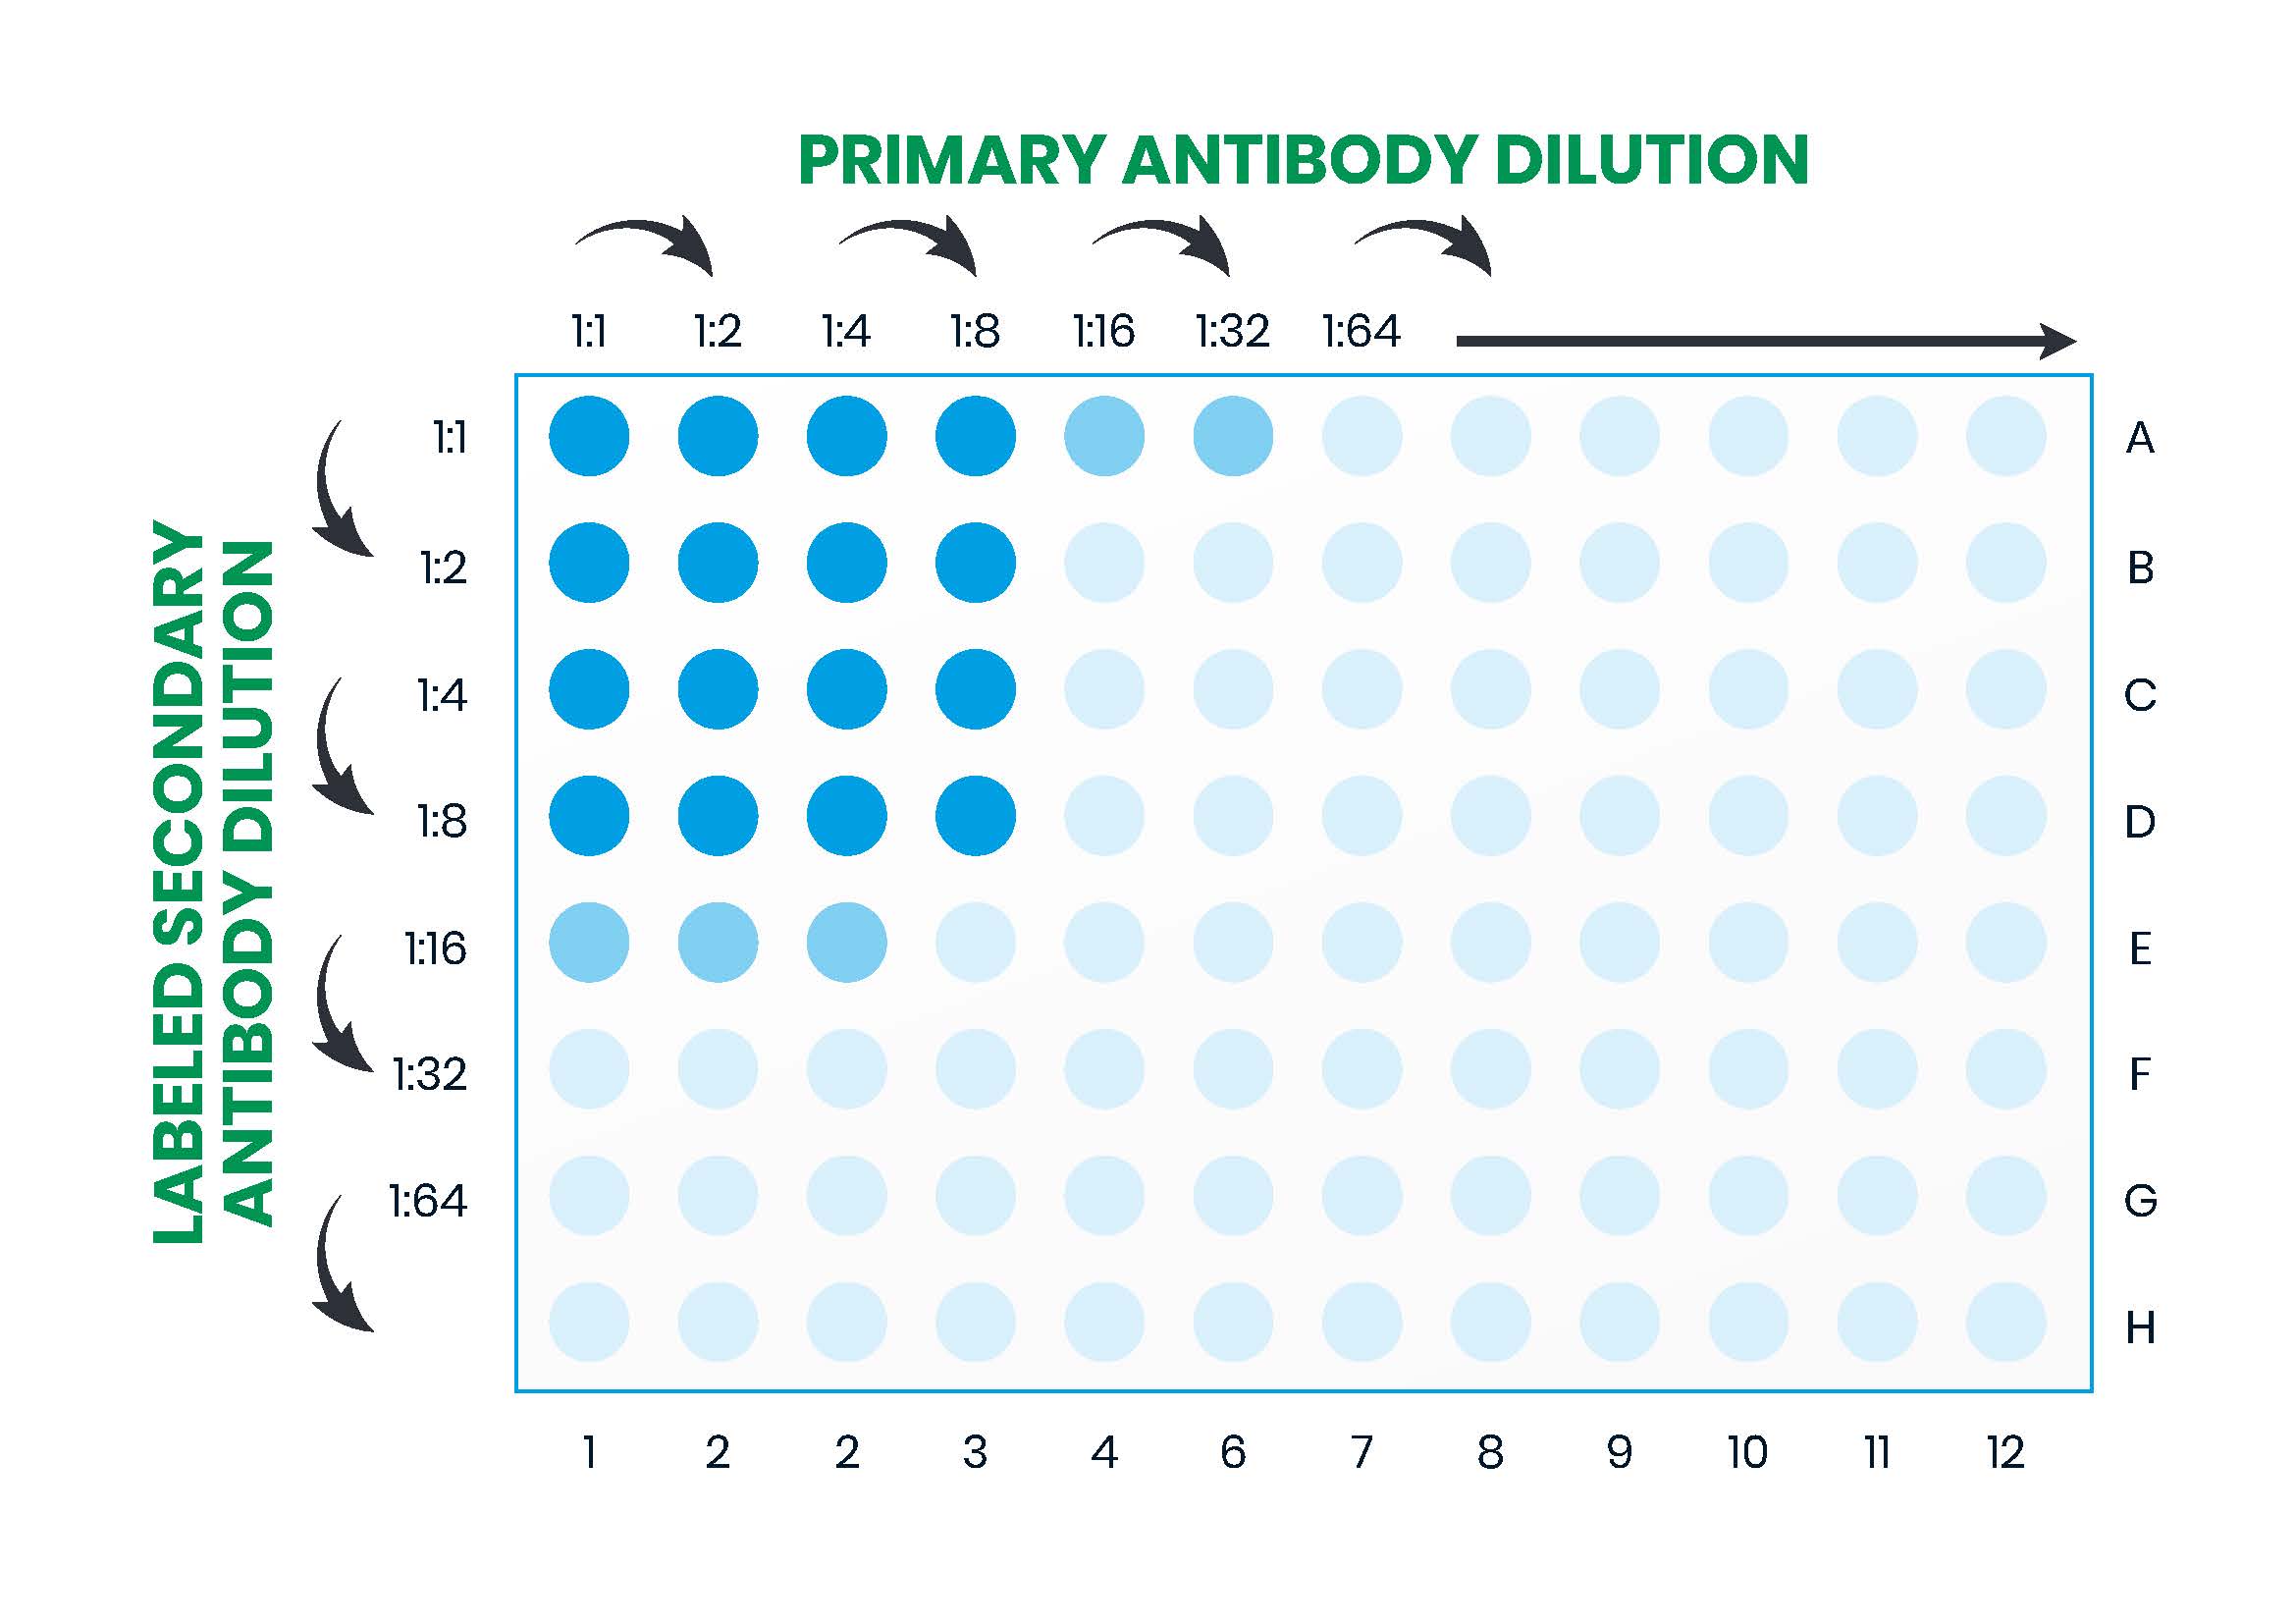
A popular approach to ELISA optimization is to set up a checkerboard assay whereby the effect of several different variables can be compared in parallel. For instance, using the example workflow depicted in Figure 10 (Part 2), the coating or primary antibody might be titrated across the 96 well microplate and the detection (secondary) antibody down the microplate while all the other variables are kept constant. This is shown in Figure 11. By setting up multiple plates in parallel to compare different blocking solutions, incubation times, washing solutions and other factors, optimal assay conditions can rapidly be determined.
In the example workflow described in Figure 10, factors requiring optimization are:
- Choice of coating buffer
- Coating antibody concentration
- Incubation time/temperature for coating
- Choice of wash buffer
- Number and duration of washes
- Choice and concentration of blocking solution
- Incubation time/temperature for blocking
- Sample dilution (dilution factor and choice of diluent)
- The concentration of conjugated detection antibody
- Incubation time/temperature for directly-conjugated detection antibody
- Choice of substrate
- Incubation time/temperature for signal development
Additionally, it is important to identify suitable controls and standards and to determine how best to store and handle these.
Controls and Standards
Controls and standards are essential to any immunoassay but are of particular importance to ELISA where they are used to quantify the analyte of interest. For this reason, they should always be included on every plate and should ideally be run in duplicate or triplicate. It is good practice to use the same batch of control/standard material across all plates in an assay to avoid any intraplate variability, and to perform comparative studies every time a new lot is brought into use.
Positive controls function to confirm that the ELISA is performing as expected. They typically comprise a known amount of the target analyte and produce a maximal assay signal that can be used in defining the standard curve.
Like positive controls, standards are known quantities of the target analyte. They are used to generate a concentration curve against which the analyte of interest can be quantified, making them fundamental to the interpretation of ELISA data.
Negative controls lack one or more of the assay components necessary to detect the target analyte. They provide an indication of non-specific binding within the ELISA and, along with positive controls, are used in defining the standard curve.
Other types of control worth considering include:
- Wavelength correction – this is typically built into a spectrophotometer and addresses changes in background absorption that can occur due to factors such as the type of plasticware or the presence of condensation
- Non-specific binding controls – wells that contain no analyte but that include all other assay components necessary to generate a signal; these may be subtracted from all data points to correct for background, a process often referred to as blanking
- Secondary/detection antibody controls – designed to evaluate secondary antibody binding in the absence of primary antibody and/or capture antibody
- Total activity controls – wells where substrate and enzyme are incubated in the absence of all other reaction components and which ensure color development is not compromised by the assay conditions
To maintain experimental consistency, controls, standards, and test samples should always be handled similarly, with controls and standards being diluted in a matrix matching that of the sample material. It is also worth considering purchasing controls/standards in bulk since this guarantees their availability for the lifetime of the ELISA and can often be more cost-effective than purchasing reagents ad hoc.
Validation
ELISA validation is essential to quantify analytes accurately. Not only do validation results confirm that samples are compatible with the ELISA, but they can also highlight potential sources of assay interference that could lead to erroneous analysis further downstream. Although validation must always be tailored to the ELISA that is being developed, several types of validation experiments are widely used, as discussed below.
Spike and Recovery
Spike and recovery experiments are designed to assess the impact of the sample matrix on the ELISA readout, for example, to confirm that components present in serum do not contribute to the ELISA signal. After adding a known amount of the analyte to both the sample matrix and to the diluent used to prepare the standard, the ELISA is run to completion and the responses are calculated against a standard curve. Ideally, there should be little difference between the two conditions. Where this is not the case, it is advisable to dilute the standard in a matrix more closely mirroring that of the sample (e.g. using cell lysis buffer where the samples are cell lysates).
Dilutional Linearity
The aim of a dilutional linearity experiment is to assess the compatibility of the ELISA with samples containing different amounts of the analyte. Determining the linear range of the assay ensures the concentration of any unknown samples is calculated correctly. A common approach is to spike a known amount of the analyte into a sample that is above the upper detection limit of the standard curve before serially diluting this to below the lower limit of quantification. Samples having mean concentrations within the upper and lower limits of the standard curve should show little difference in the observed concentration compared to the predicted concentration. Where this is not so, it may be necessary to optimize the sample diluent so that it is better suited to the ELISA.
Parallelism
Parallelism is used to ascertain whether antibody binding affinity differs between the endogenous analyte and the analyte used to generate the standard curve. It can highlight the impact of sample matrix components on antibody binding. A typical parallelism experiment involves serially diluting samples known to contain a naturally high concentration of the analyte until the concentration falls below the lower detection limit of the standard curve and then analyzing these as normal. After calculating the concentration of each dilution and determining the coefficient of variation or %CV (the ratio of the standard deviation to the mean), a loss of parallelism is indicated where the %CV is higher than acceptable, indicating a need to address potential matrix effects.
Data Analysis
ELISA data is typically analyzed using a software package built into the plate reader, using Microsoft™ Excel™ or third-party analysis software once the data has been exported. First the standard curve is generated, then this is used as a reference against which the sample wells can be quantified.
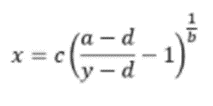
For ELISA results to be useful, it is important to follow best practice guidelines for data analysis. The first of these is to use a 4-parameter logistic regression algorithm to generate the standard curve, whereby x is the independent variable and y the dependent variable in the equation shown in Figure 12:
It is also important to subtract background signal from all of the data points and to consider any dilution factors when calculating results. Additionally, the average, standard deviation and %CV should always be determined when running replicates since these will provide an indication of data integrity and can be used to monitor ELISA performance over time.

| Learn more: | Do more: |
|---|---|
| Colorimetric western blotting | Spectra Viewer |
| Chemiluminescence western blotting | Antibodies for signal enhancement |
| Fluorescent western blotting | |
Technical Resources | About us | Contact us | Bulk Service
Licenses | Conditions of Use | Privacy Policy | Ordering Information

FM 545248